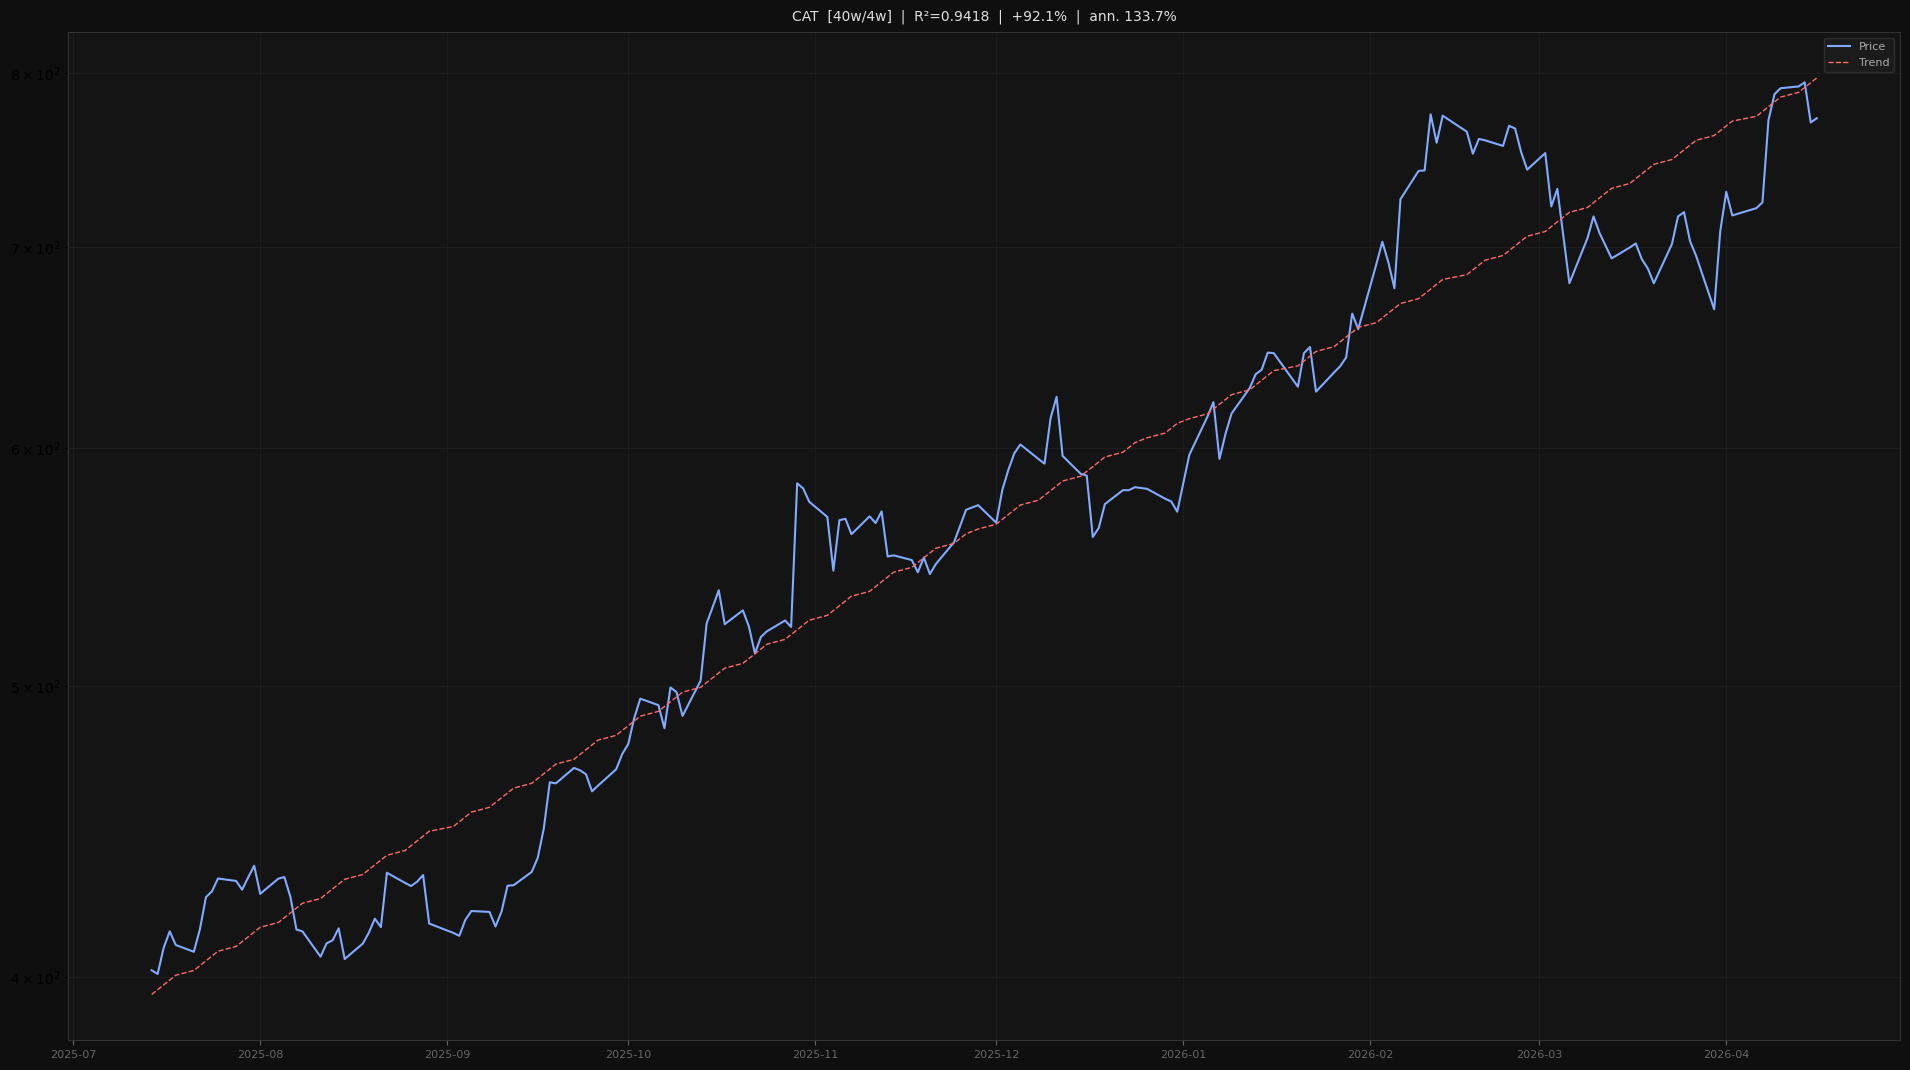
CAT showed a highly consistent uptrend over the past 40 weeks (analysis frame: 40w/4w), scoring an R² of 0.9418. R² measures how closely the price followed a straight logarithmic trend line — a score of 1.0 represents a perfectly linear rally with no deviation. The stock gained 92.1% over the lookback period, equivalent to an annualised return of 133.7%. As of week 2026-W16, CAT last traded at $772.66. Momentum modelling projects a solid continuation: the statistical exit target (Exit B, k=0.75σ) is +6.1% ($819.72) by May 16, 2026, with a stop-loss level at -6.1% ($725.60). This analysis was generated by StraightR, a momentum screening tool that ranks US equities by the linearity of their logarithmic price trend across multiple lookback frames (26w, 40w, 52w, 78w).